If everything is important, nothing is important.
At Shopify, the teams handling inventory and shipping were in touch with businesses of all sizes. It’s great for understanding users and developing empathy for small business, but it doesn’t help determine impact in roadmap planning.
Teaming up with two data scientists, I aimed to motivate the order management and fulfillment teams to target a specific audience. Without a target segment, we’d continue to struggle with feature adoption and lack direction while juggling the feature requests from millions of businesses.
Kicking off a hack-days project
We didn’t have buy-in to start, so the initiative began as a scrappy “hack days” project over the course of three days. We’d need to be scrappy over the course of hack days, so we could ask our leads for time to continue working over the coming weeks.
The team
Role: researcher and project lead
Team: two data scientists and myself
The timeline
Alignment: 3 days
Research & analysis: 3 weeks
Method
Over a three-day period, we worked together to determine the attributes that made businesses different. My research directed us to order volume, which was a good proxy for effort, since every new order needs to be shipped, and each one takes time. This means employees, larger warehouses when self-shipping, and more inventory coming and going.
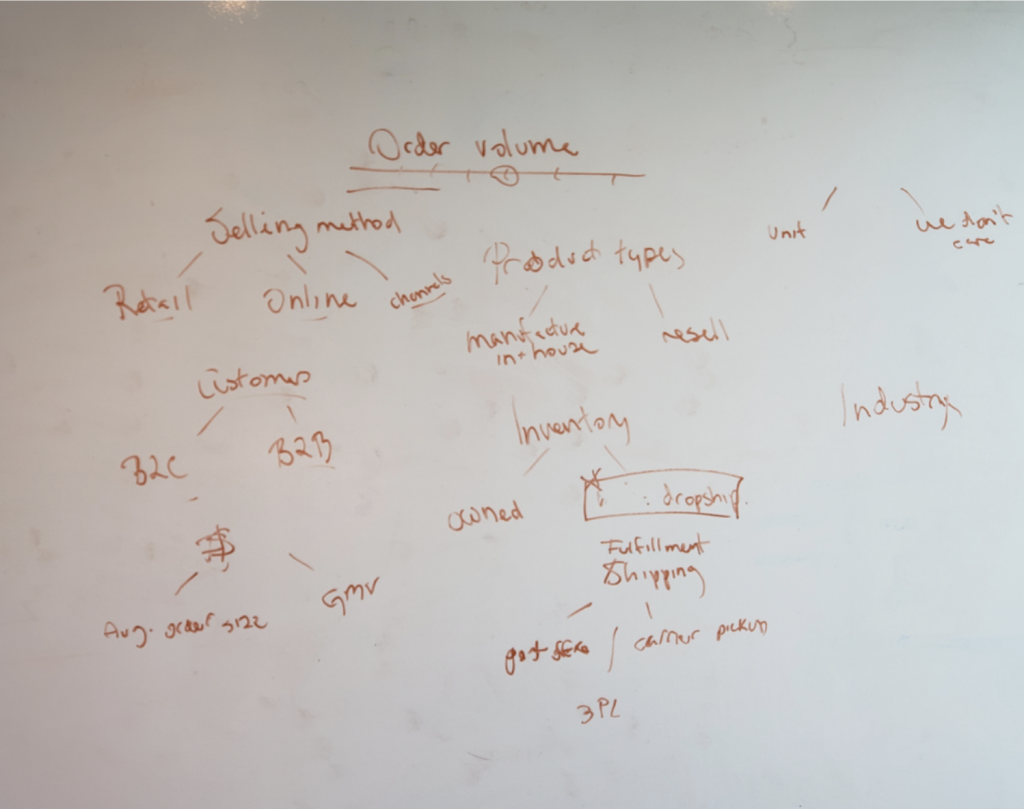
our user’s businesses differ from one another. At this point, we weren’t focused on ensuring the
data was available — we just wanted a framework to start from, and to identify the key data
point to measure everything else by.
Eventually, we confirmed order volume’s impact on many other attributes, like whether they manufactured their own products (makers generally had lower order volume compared to businesses with suppliers), and how businesses shipped.
We then worked together to identify other signals, such as app and feature usage, to slice by order volume.
Using surveys efficiently
I hesitated to do a survey because of low response rates across all researchers over the summer and fall period leading up to Black Friday.
My first challenge was to check if any existing surveys from our market research team (which had priority when sending mass surveys and ran one every spring) had useful questions for our team.
Luckily, they included questions about using 3rd party logistics, warehouses, and physical store locations, among others. This gave us 20,000 responses over 3 years for our research to learn from.
giving us years worth of information to re-interpret.
I joined each survey respondent with data from our backend: order volume at the time of the survey, the shipping methods used, and what apps they had installed.
With order volume as the primary method of segmenting responses, I analyzed the survey data, I analyzed the responses from a new perspective (originally the survey had been split by other survey responses, like region and sales volume – which is different than order volume).
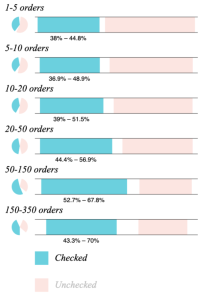
Statistics was fun to get back into with some guidance from my peers. The chi-squared test of independence was often used to see if survey responses varied by order volume.
Impact
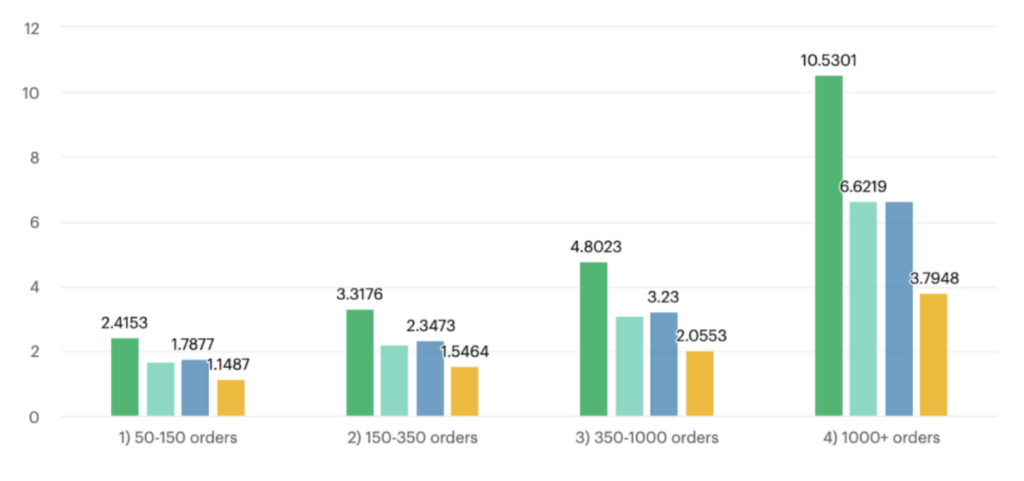
We found a sweet spot in order volume that triggered people to stop using Shopify for order management. When companies reached this order number, they changed how they operated – using 3rd party apps and logistics overtaking usage of Shopify’s workflows.
After sharing with leadership, this became the department’s target. It shaped the roadmap for the next two years, and focused our qualitative research and interviews for a specific group.
Once department leadership approved these segments, the data scientists and I shared insights with the broader team to give them a picture of who we were solving for. This included example local business, employee counts, sales channels, workflow details like shipping methods, the preferred apps to replace Shopify’s default solutions, unmet needs, and feedback on specific features taken from the survey and other sources where we were able to join their company ID.